Identifying comparative advantage - recording transcript
In a simple two-goods economy where only grapes and nuts are produced, we can represent the production function with a two-dimensional diagram, with grapes on the vertical axis and nuts on the horizontal axis. (para1)
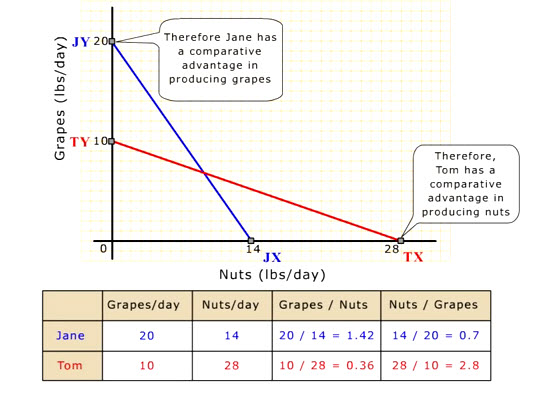
In this economy, we have two workers. One of them, Jane, can produce a maximum of 20 lbs of grapes per day, or 14 lbs of nuts per day. The linear production function can be represented by a straight line through the vertical intercept (20) and the horizontal intercept (14). This production function is commonly known as Production Possibilities Curve (PPC for short) or Production Possibilities Frontier (PPF for short). The straight-line production function represents various combination of grapes and nuts that Jane could produce in one day, ranging from all grapes (20) to all nuts (14). (para2)
The other worker, Tom, can produce a maximum of 10 lbs of grapes per day, or 28 lbs of nuts per day. We can draw Tom's linear production function similarly by linking the vertical intercept (10) to the horizontal intercept (28). The red line is Tom's PPC or PPF. It represents various combination of grapes and nuts that Tom could produce in one day, ranging from all grapes (10) to all nuts (28). (para3)
These two production functions have different slopes indicating that the relative costs of producing grapes and nuts are different between the two workers. But who has the lowest relative cost in producing each of the two products? (para4)
First, let us compare the relative costs of producing nuts in terms of grapes foregone between Jane and Tom. Suppose Tom produces 14 lbs of nuts, how many lbs of grapes does he have to give up? given his PPC. We can answer this question easily by keeping the relative slope of Tom's PPC constant but lowering the curve to start from 14 lbs of nuts on the horizontal axis. (para5)
Here we can simply read Tom's relative cost of producing 14 lbs of nuts in terms of grapes foregone from the vertical axis. That is 5 lbs of grapes. For Jane, the blue production function, she has to give up 20 lbs of grapes to produce the same 14 lbs of nuts. That is, 15 lbs more grapes than Tom. Because of Tom's lower relative cost of producing nuts in terms of grapes foregone, we say Tom has a comparative advantage in producing nuts. (para6)
We can also confirm that Tom has a comparative advantage in producing nuts in terms of grapes foregone by computing the grapes to nuts trade-off ratios for Jane and Tom. To do this, we divide the maximum grapes output by the maximum nuts output for each worker. For Tom, he has to give up only 0.36 units of grapes for each unit of nuts. But for Jane, she has to give up 1.42 units of grapes for each unit of nuts. That is, almost 4 times as high as Tom. (para7)
Similarly, we can compare the relative costs of producing grapes in terms of nuts foregone between Jane and Tom. Suppose Jane produces 10 lbs of grapes, how many lbs of nuts does she have to give up? given her PPC. We can answer this question easily by keeping the relative slope of Jane's PPC constant but lowering the curve to start from 10 lbs of grapes on the vertical axis. (para8)
Here we can simply read Jane's relative cost of producing 10 lbs of grapes in terms of nuts foregone from the horizontal axis. That is 7 lbs of nuts. For Tom, the red production function, he has to give up 28 lbs of nuts to produce the same 10 lbs of grapes. That is, 21 lbs more nuts than Jane. Because of Jane's lower relative cost of producing grapes in terms of nuts foregone, we say Jane has a comparative advantage in producing grapes. (para9)
We can also confirm that Jane has a comparative advantage in producing grapes by computing the nuts to grapes trade-off ratios for Jane and Tom. To do this, we simply divide the maximum nuts output by the maximum grapes output for each worker. For Jane, she has to give up 0.7 units of nuts for each unit of grapes, while Tom has to give up 2.8 units of nuts for each unit of grapes. That is four times as high as Jane. (para10)
So in this two-goods economy, Jane has a comparative advantage in producing grapes because of her lower relative cost of producing grapes in terms of nuts foregone. And Tom has a comparative advantage in producing nuts because of his lower relative cost of producing nuts in terms of grapes foregone. The different relative slopes of the two production functions therefore graphically illustrate the different relative costs of producing grapes and nuts between the two workers. (para11)