TR
In a market with many small firms selling homogeneous products, an individual firm is powerless to set its own price. It must take the prevailing market price as given. In other words, it is a price taker in a perfectly competitive market.
Its total revenue (TR) will be proportional to the number of units sold. Graphically, it can be represented by a straight line from the origin. The constant slope of the TR curve indicates the given market price itself.
TC
Since the price taker cannot set its own price, it is left to determine its profit- maximizing output.
To determine the profit-maximizing output level, it must compare TR with its total cost (TC).
Assuming that the price taker has some fixed inputs in the short run and that diminishing returns set in as more variable inputs are added, we will have an inverted S-shaped total cost curve TC.
Max Profit output
Profit
Caption:
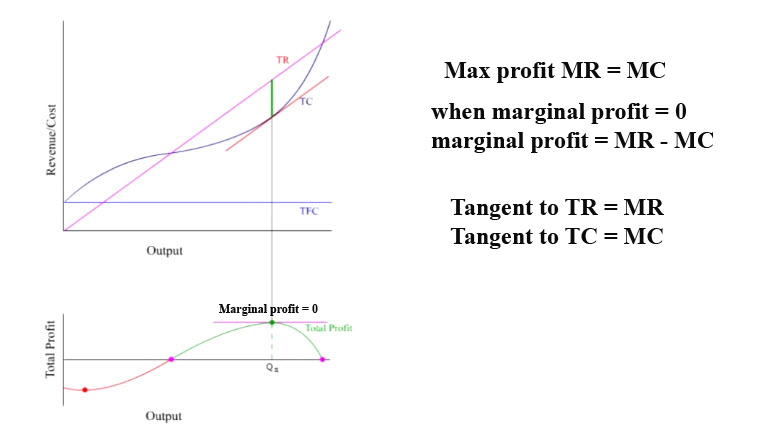
Profit = TR - TC
will be maximized when the vertical distance between TR and TC is the greatest and TR>TC.
To make the maximum-profit output level easier to identify visually... let's plot profit against output.
At Q1: TR1 < TC1, Total profit < 0
At Q2: TR2 = TC2, Total profit = 0
At Q3: TR3 > TC3, Total profit > 0
At Q4: TR4 = TC4, Total profit = 0
Given these points, the total profit curve can now be drawn.
Maximum profit occurs at the highest point on the total profit curve, where the slope of the tangent is equal to zero.
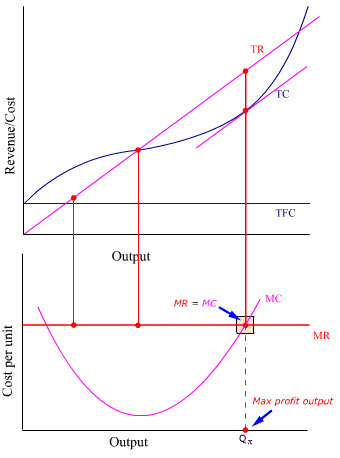
MR = MC
The slope of the tangent to the total profit curve simply measures the marginal profit, which is the difference between marginal revenue (MR) and marginal cost (MC).
Caption:
Marginal Profit = MR - MC
Zero marginal profit means that selling additional units would not add to total revenue. It also means that the additional revenue brought in (MR) is exactly offset by the additional cost (MC).
Caption:
Max profit
Marginal profit = 0
MR = MC
Since MR = slope of tangent to TR and MC = slope of tangent to TC, when MR = MC (at maximum profit output level Qπ ) the slope of the tangent to TR = the slope of the tangent to TC.
Hence, the maximum profit output level can be identified by looking at the MR and MC curves directly instead of the total profit curve.
Let's draw the MC curve first.
The inverted S-shaped TC generates a U-shaped MC.
Now, let's draw the MR curve.
The constant sloped TR curve generates a constant horizontal MR.
The maximum profit output level can now be determined by where MR intersects MC.
Observation:
For a price taker, MR is equal to the prevailing price.
Constant price means constant MR
Caption:
MR = P
Profit from P and ATC
Although MR = MC can pinpoint where the maximum profit output is, MR and MC alone cannot tell how much the maximum profit is.
To measure profit per unit output, we must compare price (P) with average total cost (ATC).
Let's bring back ATC... and AVC.
At Qπ where MR = MC, average profit is positive. So is total profit.
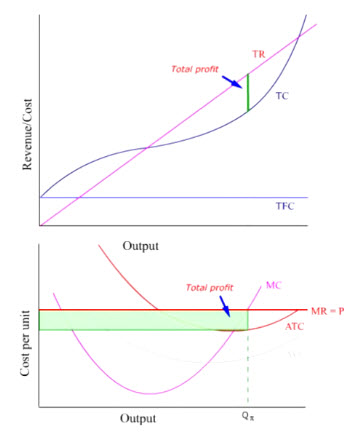
Caption: P - ATC > 0.
Total profit = (P - ATC) * Qπ
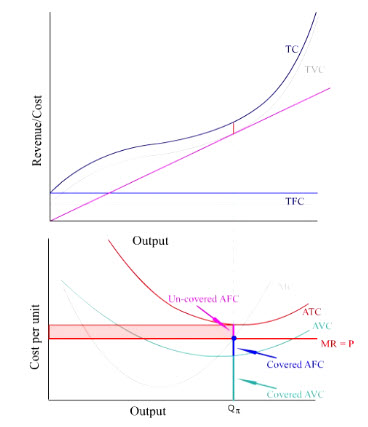
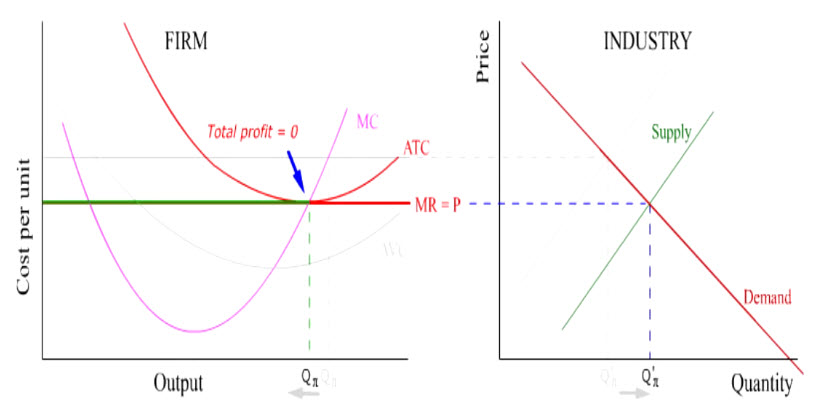
Suppose that the price were to fall. When P = minimum ATC, total profit is zero.
When P falls below minimum ATC, each unit would incur loss by bringing in less revenue than per unit cost.
Total loss would increase until none of the fixed costs is covered when price is equal to minimum AVC.
Short-run supply
Since the maximum profit output levels are determined by the intersections of MC and various levels of P, the segment of MC above minimum AVC represents the short run supply of the firm. At the minimum AVC point, the firm is indifferent between staying in business and quitting altogether. Therefore, minimum AVC is known as the shut down point for a price taker.
In the short run, as long as P > min AVC, the firm may choose to stay in business even though price does not cover all costs because part of the fixed cost is still covered.
Industry
In a perfectly competitive industry, the market price is determined by supply and demand.
This market price then becomes the horizontal demand curve of the price-taking firm.
When the market price is high, the firm makes a profit.
This positive profit will attract entry of new firms.
Entry of new firms will increase supply and shift the supply curve to the right.
Increasing supply would lower the price, which in turn lowers the profit of the firm.
Entry of new firms will continue until there is no more positive profit.
If entry is excessive, the price would be too low to cover the ATC .
Although lower price in the market will increase total quantity demanded, the output produced at each firm is reduced.