Introduction
Many goods are sold as a bundle at lower prices than the sum of the prices of the items sold separately. Under what circumstances would bundle pricing produce more net revenue than separate pricing?
Separate pricing
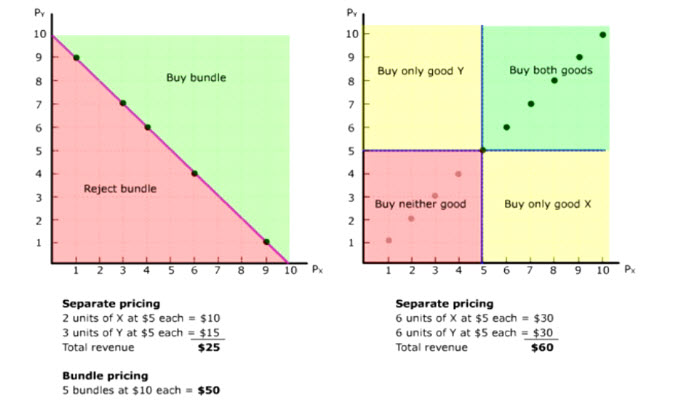
Suppose we have two goods, X and Y, and 10 buyers each with their reservation prices of X and Y. We can easily see how their reservation prices are distributed in a 2-dimensional diagram with the prices of X on the horizontal axis and the prices of Y on the vertical axis (animate).
In this diagram, each point represents the price pair of the 10 buyers. Because the points are located on a straight line from the origin, those buyers with a higher reservation price for X also have a higher reservation price for Y (animate). Their demands are technically known as positively correlated (animate).
Total revenue would be maximized under perfect price discrimination, that is charging each buyer their reservation prices for X and Y. But if price discrimination is impossible and each of the goods must be sold at a single price, what is the best single-price combination that would maximize total revenue?
Separate pricing would divide the diagram into 4 quadrants (animate). Since there no buyers in the two yellow quadrants, we need only be concerned with keeping enough buyers in the green quadrants without lowering the separate prices too much. As it turns out, total revenue would be maximized if X and Y are each sold at $5 per unit. Selling the goods in bundles at $10 each would not increase quantity sold or the total revenue.
Pure bundling
But if demands are scattered along a negatively-sloped line (animate), a buyer with a higher reservation price for X always has a lower reservation price Y and vice versa. Demands are said to be negatively correlated (animate).
In this case, separate pricing at $5 each for X and Y would turn off buyers whose reservation prices for X or Y are below $5. Total revenue amounts to only $25.
If perfect price discrimination is not allowed, the best revenue-maximizing strategy is to bundle X and Y at $10 each. At such a bundle price, all buyers whose price pairs falling on or above the bundle price line would buy the bundles (animate). Total revenue doubles under bundle pricing compared with separate pricing when demands are negatively correlated.
Mixed bundling
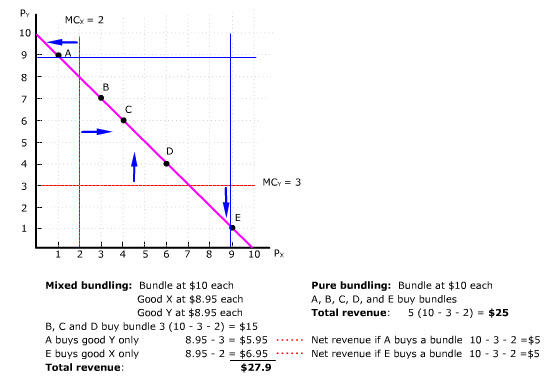
Bundling pricing gets more complicated when marginal cost is positive (animate). Because demands are still negatively correlated, it makes sense to offer bundle pricing (animate).
This is especially true in the middle segment of the bundle price line where the price pairs are above the marginal cost of X and Y (animate).
But at the bottom segment of the bundle price line, the marginal cost of Y is higher than the reservation price for Y (animate). Selling E a bundle nets only $5. But selling X separately at a little below E's reservation price for X nets $6.95 (animate). That is $1.95 above the net bundle revenue.
Similarly at the top segment of the bundle price line, the marginal cost of X is higher than the reservation price for X (animate). Selling Y separately at a little below A's reservation price nets $5.95 (animate). That is 95 cents more than the net bundle revenue of $5.
Offering bundle pricing and separate pricing simultaneously is known as mixed bundling. It maximizes net revenue by separating potential buyers into three groups: namely those buying bundles only (B, C and D), those buying only good X (E) and those buying only good Y (A).
As you can see, mixed bundling results in higher net total revenue than pure bundling when marginal costs are positive.
Extreme buyers
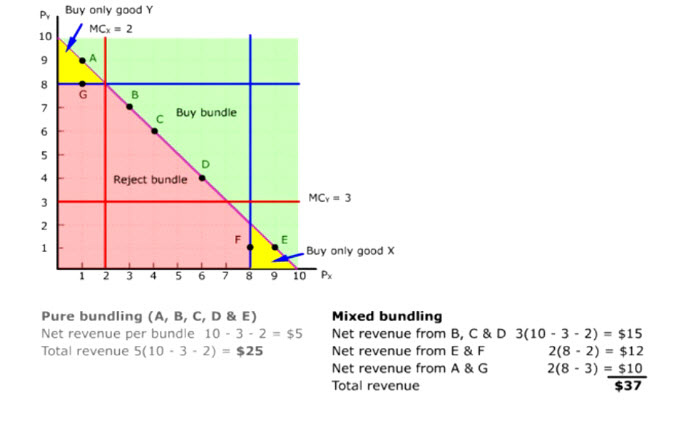
The even spread of price pairs along the bundle price line assumes that the reservation prices of buyers for X and Y vary a lot and/or that the separate prices of X and Y are very similar. In reality, the price pairs are likely to be concentrated on one end (animate) or the other end (animate) of the bundle price line.
Pure bundling may also reject too many potential buyers whose price pairs are below the bundle price line and who value one good a lot more than the other (animate). For example, F and G would have been excluded by pure bundling.
And if the marginal costs of X and Y are positive, selling bundles even to buyers whose price pairs are located on the extreme ends of the bundle price line would lead to lower total net revenue (animate). For example, selling only X to E and only Y to A would produce higher net revenue each.
Total net revenue would be a lot higher if the separate prices of X and Y are low enough to include F and G (animate). For example, if the separate prices of X and Y are set at $8 each, both E and F would buy only X and both A and G would buy only Y. But the total net revenue is a lot higher than pure bundling.
Fake bundles
Sometimes, goods are presented as a bundle when the bundle price is the same as the sum of the separate prices.
For example, the Istanbul travel guide is listed separately for $13.60 (animate). And the Turkey travel guide is listed separately for $16.50 (animate).
The total cost of the two books bough separately amounts to $30.10 (animate). But the fake bundle is listed for the same price, i.e., $30.10.
Fake bundling may catch unaware buyers who assume that bundles are usually priced lower than the items bought separately.
Summary (animate)
Pure bundle pricing is selling goods in bundles only (animate).
It can increase revenue when:
- demands are negatively correlated.
- price discrimination is impossible.
- marginal costs are zero.
(animate)
Mixed bundling is selling goods in bundles as well as separately. (animate)
It can increase net revenue when:
- demands are negatively correlated.
- price discrimination is impossible.
- marginal costs are positive.
(animate)
