Introduction
Some goods are private because we can’t get them without paying for them. Other goods are public because we can get them without paying for them. The demands for goods are different depending on whether they are public or private. (Animate title)
Definitions
If I want a bottle of soft drink, I have to pay for it. The vendor can easily exclude non-payers. And if I drink it, I alone benefit from the consumption. That same bottle would not be available for anyone else. These characteristics of excludability and rivalry are typical of “private goods.” (Animate)
But I can listen to Public Radio without paying. And my listening to “Morning Edition” does not reduce what is available to other paying or non-paying listeners. So non-excludability and non-rivalry is typical of “public goods.”
Public goods refer to the nature of the goods and should not be confused by how they are funded. A tax-funded good may not be a “public good” if it is excludable and rivalrous in nature. For example, public schools are not a public good since the market can just as easily provide excludable and rivalrous private education.
Private goods -discrete
The market demand for private goods at a given price consists of counting how many units will have marginal utility that is at least equal to that price.
Here, we have 3 consumers, each with a different demand schedule for a private good. The vertical bars represent the maximum price each consumer is willing to pay for a particular unit of the private good.
When the price is too high, say at P1, there may be no demand.
As the price is lowered to P2, 2 units will be sold. (Animate).
As the price is lowered to P3, 4 units will be sold (Animate).
So the aggregate demand schedule is a horizontal summation of individual demand at various prices.
Public goods - discrete
At the lower panel, we have 3 consumers, each with a different demand curve for a public good. The vertical bars represent the maximum price each consumer is willing to pay / for a particular unit of the public good.
These demand schedules look the same as those for private goods. But non-rivalry in consumption means that each unit can simultaneously provide benefit to all consumers.
At price P1, the good is too expensive for each of the three consumers. But we need to look at the sum total of the individual marginal utility of each unit.
So the aggregate demand schedule must represent the vertical summation of the individual marginal utility for each unit.
When the individual marginal utilities are added vertically, we have a demand schedule that tells a different story. (Animate)
At P1, the total marginal utility of the third unit is higher than the market price.
And at all price levels, the vertically summed aggregate demand is much higher than it would be if the aggregate demand is horizontally summed.
Using the horizontally summed aggregate demand would lead us to consistently underestimate the efficient aggregate demand for public goods. So public goods might not be provided or under-provided if market organizations for private goods are used
To avoid market failure, Public Radio was originally funded through tax dollars. But the share of public funding is now increasingly replaced by organizational sponsorship and individual generosity.
But because of non-excludability, free ridership is rampant. Less than 10% of the listeners donate any money to their local Public Radio stations.
Summary – discrete demand
To summarize, the upper panel shows the demand schedule for a private good. Because of rivalry in consumption, the market demand schedule is derived by horizontally summing the individual demand at various prices.
The lower panel shows the demand schedule for a public good. Because of non-rivalry in consumption, the ideal market demand schedule is derived by vertically summing the individual marginal utility of each unit.
Private goods – continuous
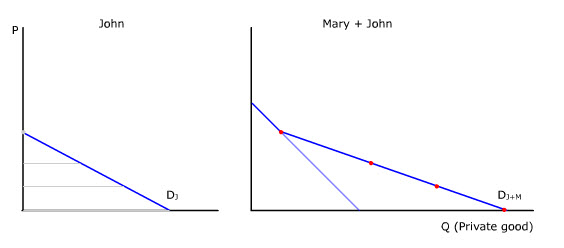
To see more clearly that the demand curve for a private good represents a horizontal summation of individual demand curves, let us generate a market demand curve from two individual consumers with straight-lined demand curves.
Here, we will add the number of units demanded individually at each price, horizontally, to generate the market demand curve.
I will select four points from John’s demand curve and added them horizontally to Mary’s demand curve. (Animate)
First point. Second point. Third point. Last point.
The generation of a market demand curve for a private good is now completed.

Public goods – continuous
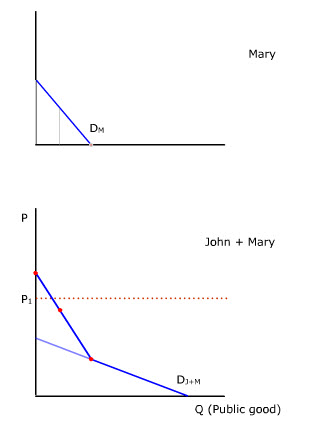
To see more clearly that the demand curve for a public good represents a vertical summation of individual demand curves, let us generate an aggregate demand curve from two individual consumers with straight-lined demand curves.
Here, we will add the individual marginal utility for each unit vertically to generate the aggregate demand curve. (Animate)
I will select three points from Mary’s demand curve and add them vertically to John’s demand curve. (Animate)
First point. Second point. Last point.
The generation of an aggregate demand curve for a public good is now completed.

Second summary
To summarize, private goods are excludable and rivalrous. The market is quite capable of providing such goods on its own.
Public goods are non-excludable and non-rivalrous. Without some extra-market organization to pool funding, most public goods will not be provided due to rampant free-ridership.
