Introduction
The market consists of buyers and sellers. Buyers want to pay as little as possible. Sellers want to charge as much as possible. It is the interactions between demand from buyers and supply from sellers that determine the market-clearing price and the quantity sold and bought.
The demand curve
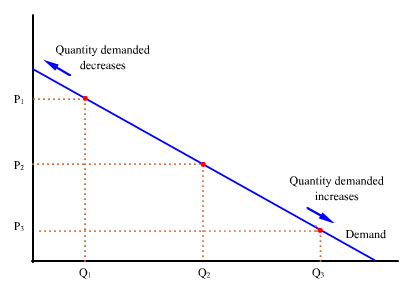
Since buyers want to pay as little as possible, it is reasonable to assume that a greater quantity would be demanded when the price is lower (animate). So the demand curve might look like a downward sloping curve (animate). The vertical intercept represents the highest possible price any buyer would pay (circle). And the horizontal intercept represents the maximum amount that would be needed even if it is free (circle).
When more is bought at lower prices, we say the quantity demanded has increased (animate). When less is bought at higher prices, we say the quantity demanded has decreased (animate).
The supply curve
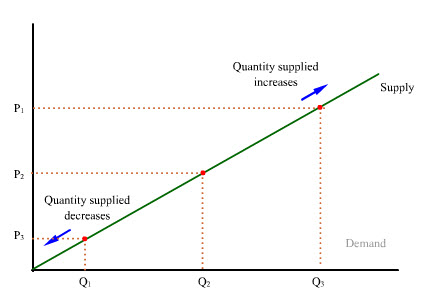
Since sellers want to charge as much as possible, it is reasonable to assume that a greater quantity would be supplied when the price is higher (animate). So the supply curve might look like an upward sloping curve (animate).
When more is sold at higher prices, we say the quantity supplied has increased (animate). When less is sold at lower prices, we say the quantity supplied has decreased (animate).
Price determination
(Animate) Given these supply and demand curves, the market price is determined by trial and error.
If the price is set too high, the quantity supplied will exceed the quantity demanded (animate). The resulting gap is called “surplus” or “excess supply” (animate). This surplus will disappear as price is lowered until the quantity supplied is just equal to the quantity demanded (animate).
If the price is set too low, the quantity demanded will exceed the quantity supplied (animate). The resulting gap is called “shortage” or “excess demand” (animate). This shortage will disappear as price is raised until the quantity demanded is just equal to the quantity supplied (animate).
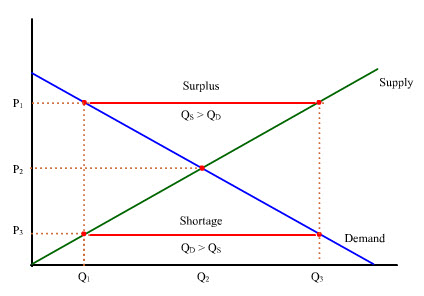
When the quantity supplied is equal to the quantity demanded, the market is said to be cleared (animate). Given these supply and demand curves, the market will return to this position if it is temporarily disturbed. So the market is also said to be in equilibrium (animate text).
Demand shifts
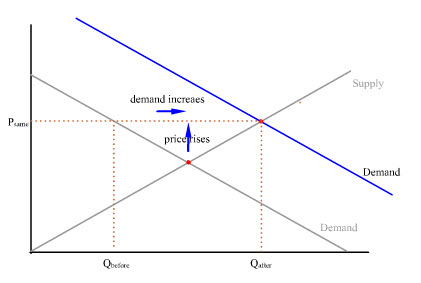
When more is demanded at the same price, demand (rather than quantity demanded) is said to have increased (animate). With supply remaining unchanged, an increase in demand will push up price. After the market clears, a larger quantity is sold at a higher price when demand increases (animate).
When less is demanded at the same price, demand (rather than quantity demanded) is said to have decreased (animate). With supply remaining unchanged, a decrease in demand will push down price. After the market clears, a smaller quantity is sold at a lower price when demand decreases (animate).
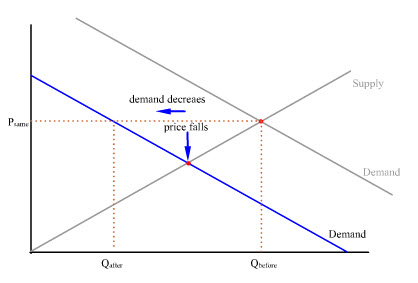
Under most circumstances, a change in demand is a result of changes in factors other than the own price of the good in question. For example, a change in demand may be the result of changes in preferences and/or income.
Supply shifts
When less is supplied at the same price, supply (rather than quantity supplied) is said to have decreased (animate). With demand remaining unchanged, a decrease in supply will push up price. After the market clears, a smaller quantity is sold at a higher price when supply decreases (animate).
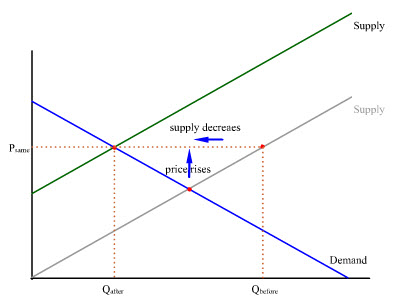
When more is supplied at the same price, supply (rather than quantity supplied) is said to have increased (animate). With demand remaining unchanged, an increase in supply will push down price. After the market clears, a larger quantity is sold at a lower price when supply increases (animate).
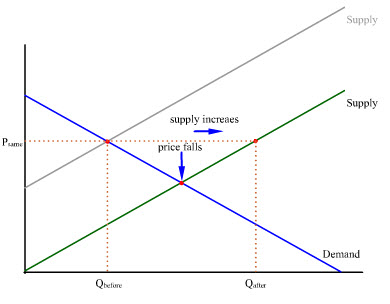
Under most circumstances, a change in supply is a result of changes in factors other than the own price of the good in question. For example, a change in supply may be the result of changes in weather conditions and/or costs of materials.
Summary
• In a free market, interactions between supply and demand will determine market price and quantity demanded and supplied (animate).
• When price is too high, surplus will occur. This surplus will disappear if price is allowed to fall (animate).
• When price is too low, shortage will occur. This shortage will disappear if price is allowed to rise (animate).
