Introduction
Two goods (A and B) are complementary if using more of good A requires the use of more good B. For example, ink jet printer and ink cartridge are complements.
Two goods (C and D) are substitutes if using more of good C replaces the use of good D. For example, Pepsi Cola and Coca Cola are substitutes.
Complementary goods and substitute goods are good examples to illustrate the difference between changes in demand vs changes in quantity demanded.
Complementary goods
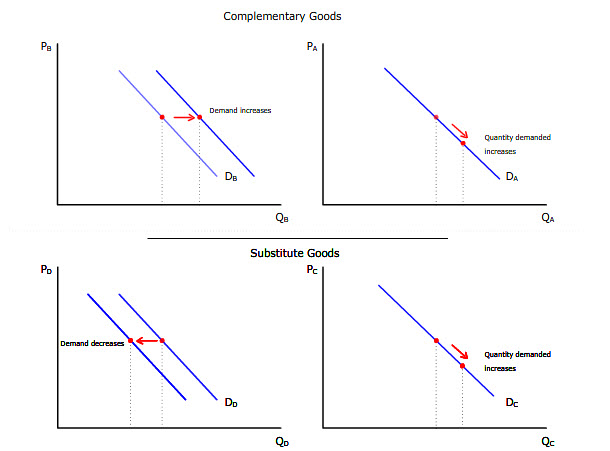
Here we have the demand curves for two complementary goods (A and B). Suppose the price good A goes down on the right panel. The law of demand tells us that more of good A will be purchased by moving down the demand curve. In other words, the quantity demanded for good A will increase.
Since goods A and B are complementary, more good A requires the use of more good B. But the price of good B has not changed. So more good B would be bought only if the demand for good B increases by shifting to the right.
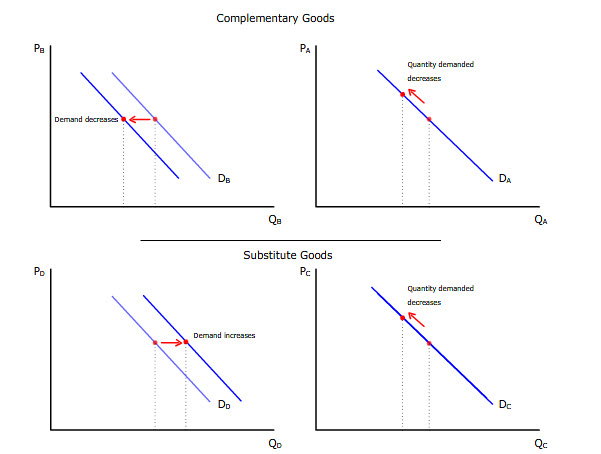
A price increase in good A, on the other hand, will lead to a decrease in quantity demanded for good A and a decrease in demand for good B.
Substitute goods
On the lower panels, we have two substitute goods (C and D). Suppose there is a price decrease in the price of good C on the right panel. The law of demand tells us that more of good C will be purchased by moving down the demand curve. In other words, the quantity demanded for good C will increase.
Since goods C and D are substitutes, more good C will replace the use of good D. But the price of good D has not changed. So less good D would be bought only if the demand for good D decreases by shifting to the left.
A price increase in good C, on the other hand, will lead to a decrease in quantity demanded for good C and an increase in demand for good D.
Summary
Complementary goods
quantity demanded for good A up --> demand for good B up
quantity demanded for good A down --> demand for good B down
Substitute goods
quantity demanded for good C up --> demand for good D down
quantity demanded for good C down --> demand for good D up