Purchasing Power Parity
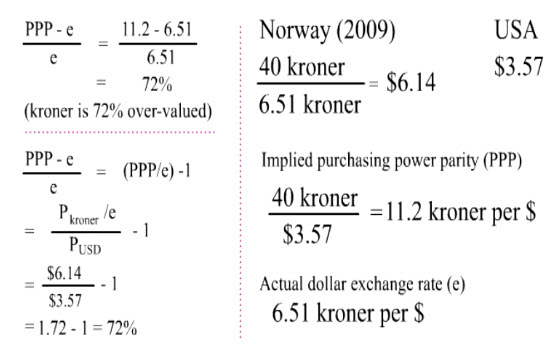
The big mac sold for 40 kroner in Norway and $3.57 in the US in 2009.
If $3.57 could buy 40 kroner in the foreign exchange market, the big mac in Norway would have cost the American buyer the same in both countries.
In other words, the implied exchange rate should be (40 kroner/$3.57 = ) 11.2 kroner per dollar. We call the implied exchange rate the purchasing power parity (PPP) because this rate would have equalized the price of the big mac in both countries.
But the actual exchange rate was only 6.51 kroner per dollar. So, the kroner actually was more expensive than the implied purchasing power parity (PPP).
By comparing these 2 exchange rates, we can get a rough idea how much the kroner was over-valued.
First, subtract the actual exchange rate (e) from the purchasing power parity (PPP).
Then divide the difference by the actual exchange rate (e).
This comparison shows that the kroner was over-valued by 72%.
This same formula for computing over or under valuation of foreign currencies can be transformed to compare the prices in US dollar by dividing the numerator and the denominator by the actual exchange rate (e).
The transformed formula says that we can first convert the kroner price into dollar price using the actual exchange rate (e), and divide the dollar price in Norway by the dollar price in the US.
We can get the same 72% over-valuation percentage by subtracting one from the dividend.
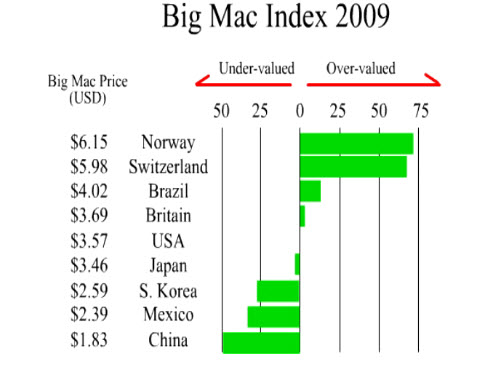
Big Mac Index
Lets go shopping in selecting countries to find the most expensive and the least expensive big mac by comparing their prices in dollar.
In 2009, the big mac sold for $3.57 in the US.
$3.69 in Britain, $4.02 in Brazil, $5.98 in Switzerland, $6.15 in Norway.
So Norway had the most expensive big mac in the world.
Which country had the least expensive big mac?
Japan sold its big mac for $3.46, South Korea for $2.59, Mexico for $2.39. And China for $1.83.
So China had the least expensive big mac in the world.
If we divide the local price in dollar by the US price and subtract 1 from the quotient, we have a rough idea of how much the local currencies are over or under valued from the purchasing power parity.
Norway had the most expensive big mac because its local currency, the kroner, was over-valued by 72%.
And China had the least expensive big mac because its local currency, the yuan, was under-valued by 49%.
Maybe your next hunger trip should be to China?
Real exchange rate
Instead of comparing the actual exchange rate to the purchasing power parity to see which foreign currency is over or under valued, we can directly compare the prices of the goods themselves and see which one is more expensive.
To do this we need the actual exchange rate (e) and the local prices of big mac, say in Norway and the USA.
Convert the kroner price into US$ and divide the US dollar price by the Norway dollar price. We see that the big mac is only 58% that in Norway.
Alternatively, we can compare the prices in terms of kroner.
Convert the US price into kroner price and divide it by the Norway kroner price. Again, a big mac is still 58% that in Norway.
Comparing the price of a domestic item with the foreign item using the same currency is to compute the real exchange rate (e subscript R).
The real exchange rate tells you how much a domestic item is worth compared to a similar foreign item.
If the real exchange rate is less than 1, the domestic item is less expensive.
If the exchange rate is more than 1, the domestic item is more expensive.
Substituting math symbols into the formula and taking the reciprocals on both sides of the equation, and multiplying both sides by the actual exchange rate (e), we can see that dividing the actual exchange (e) by the real exchange rate (e sub R) is equivalent to computing the purchasing power parity (PPP).
Lets substitute some numbers into the equation.
e is 6.51 kroner per $. E sub R is 0.58. Norway kroner price is 40. USA price is $3.58. The end result is 11.2 kroner per $, exactly equal to the PPP we compute earlier.
If the real exchange rate (e sub R) is 1, meaning the domestic item and the similar foreign item cost the same, the actual exchange rate (e) should be equal to the purchasing power parity (PPP).
Definitions and Formulae
Lets go over the definitions and formulae one more time.
Summary
* The actual exchange rate does not guarantee that the same items would be sold at the same prices across countries.
* The real exchange rate informs the consumer where the cheapest goods are.
* The purchasing power parity and the actual exchange rate are unlikely to converge because some goods are not traded and goods are seldom identical.
* Also, the exchange values of many currencies are not freely determined in the exchange market.