Lowering prices to increase sales is a popular marketing tool. But it is important that increasing sales means increasing total revenue and not simply increasing unit sales. Whether lower prices lead to higher total revenues depends on how elastic demand is to lower prices.
When a firm faces a downward sloping demand curve, it must search for the maximum profit price.
Show downward-sloping demand curve
e.g., a firm in monopoly or monopolistic competition is such a price searcher
A downward-sloping demand curve means that more could be sold only at a lower price. High price, low quantity. Low price, high quantity.
Demonstrate by picking two price-quantity pairs.
Single pricing means that one uniform price applies to all the units sold. In other words, to sell just one more unit, the seller must lower the price for all other units.
Show animation
If the firm can charge only a single price to all buyers, it must balance the additional quantity sold due to a lower price and the lower revenue from each unit sold.
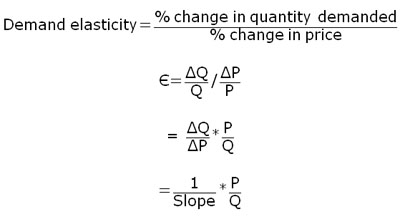
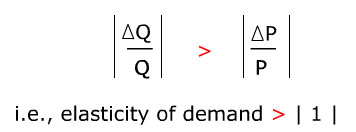
If the percentage change in quantity sold is greater than the percentage change in price, total revenue will increase when a lower price is charged. When that happens, demand is said to be elastic. And the elasticity of demand has an absolute value greater than 1. For example, a 10% price decrease leading to a 20% quantity increase will give you an elasticity greater than 1.
Show animation
Lets look at the effect of price decrease on total revenue when demand is elastic. The blue rectangular area in the lower panel and the vertical distance in the upper panel both represent total revenue. The vertical distance in upper panel simply maps the rectangular area in the lower panel as more units are sold at lower prices.
Total revenue increases when price decreases because demand is elastic. In other words, the % increase in quantity more than offsets the % decrease in price.
Because a single price must be charged to all buyers, at some point the percentage change in quantity will be just equal to the percentage change in price.
When that happens, demand is said to be unit elastic.
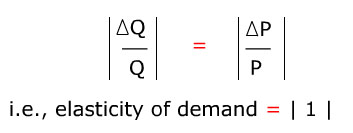
Total revenue reaches the maximum when demand is unit elastic.
Show animation
Any further price decrease beyond the maximum total revenue point will lead to lower revenue because the percentage change in quantity will be smaller than the percentage change in price.
When that happens, demand is said to be inelastic.
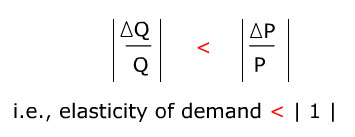
Total revenue decreases as price decreases when demand is inelastic .
Show animation
When demand is inelastic, total revenue could be increased by increasing price instead of decreasing price.
Show animation
As you can see, a constant-sloped demand curve does not mean constant demand elasticity along the whole length of the demand curve.
To the left of the mid-point, demand is elastic. At mid-point, demand is unit elastic. To the right of the mid-point, demand is inelastic.
Show graphics and point to 3 ranges of elasticity along the demand curve.
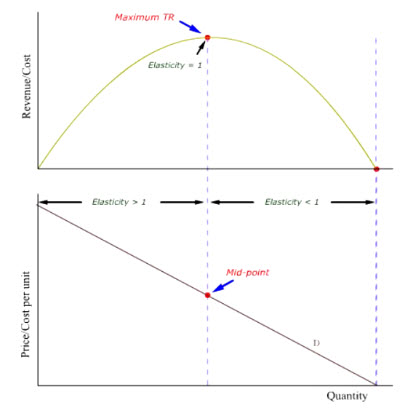
Demand elasticity at any given point must take into account both the slope of the demand curve as well as the relative position of price charged and quantity demanded.